All you need to know about NDVI
Published on Dec 29, 2024 | Bikesh Bade | 38 Views
NDVI has been one of the foremost commonly used vegetation indices in remote sensing since its introduction in the 1970s. With the increased availability of remotely sensed imagery from satellites and UAVs, more and more people have adopted NDVI in their activity beyond the scope of science.
And yet, there’s still an absence of information and plenty of misbeliefs around these mysterious vegetation indices. to assist users in better understanding a way to work with NDVI in the handiest way and reap the most benefits, we decided to come back up with this go-to FAQ.
What is NDVI in remote sensing?
The Normalized Difference Vegetation Index is a simple indicator of photosynthetically active biomass or, in layman’s terms, a calculation of vegetation health. Simply put, NDVI helps to differentiate vegetation from other types of land cover (artificial) and determine its overall state. It also allows us to define and visualize vegetated areas on the map as well as to detect abnormal changes in the growth process.
How to calculate NDVI?
NDVI value ranges between -1.0 and +1.0. Generally speaking, NDVI shows a functional relationship with vegetation properties (e.g. biomass). NDVI is directly related to the photosynthetic capacity and energy absorption of plant canopies. The NDVI is calculated from these individual measurements as follows:
NDVI= (NIR-Red) \ (NIR+Red)
How does NDVI work?
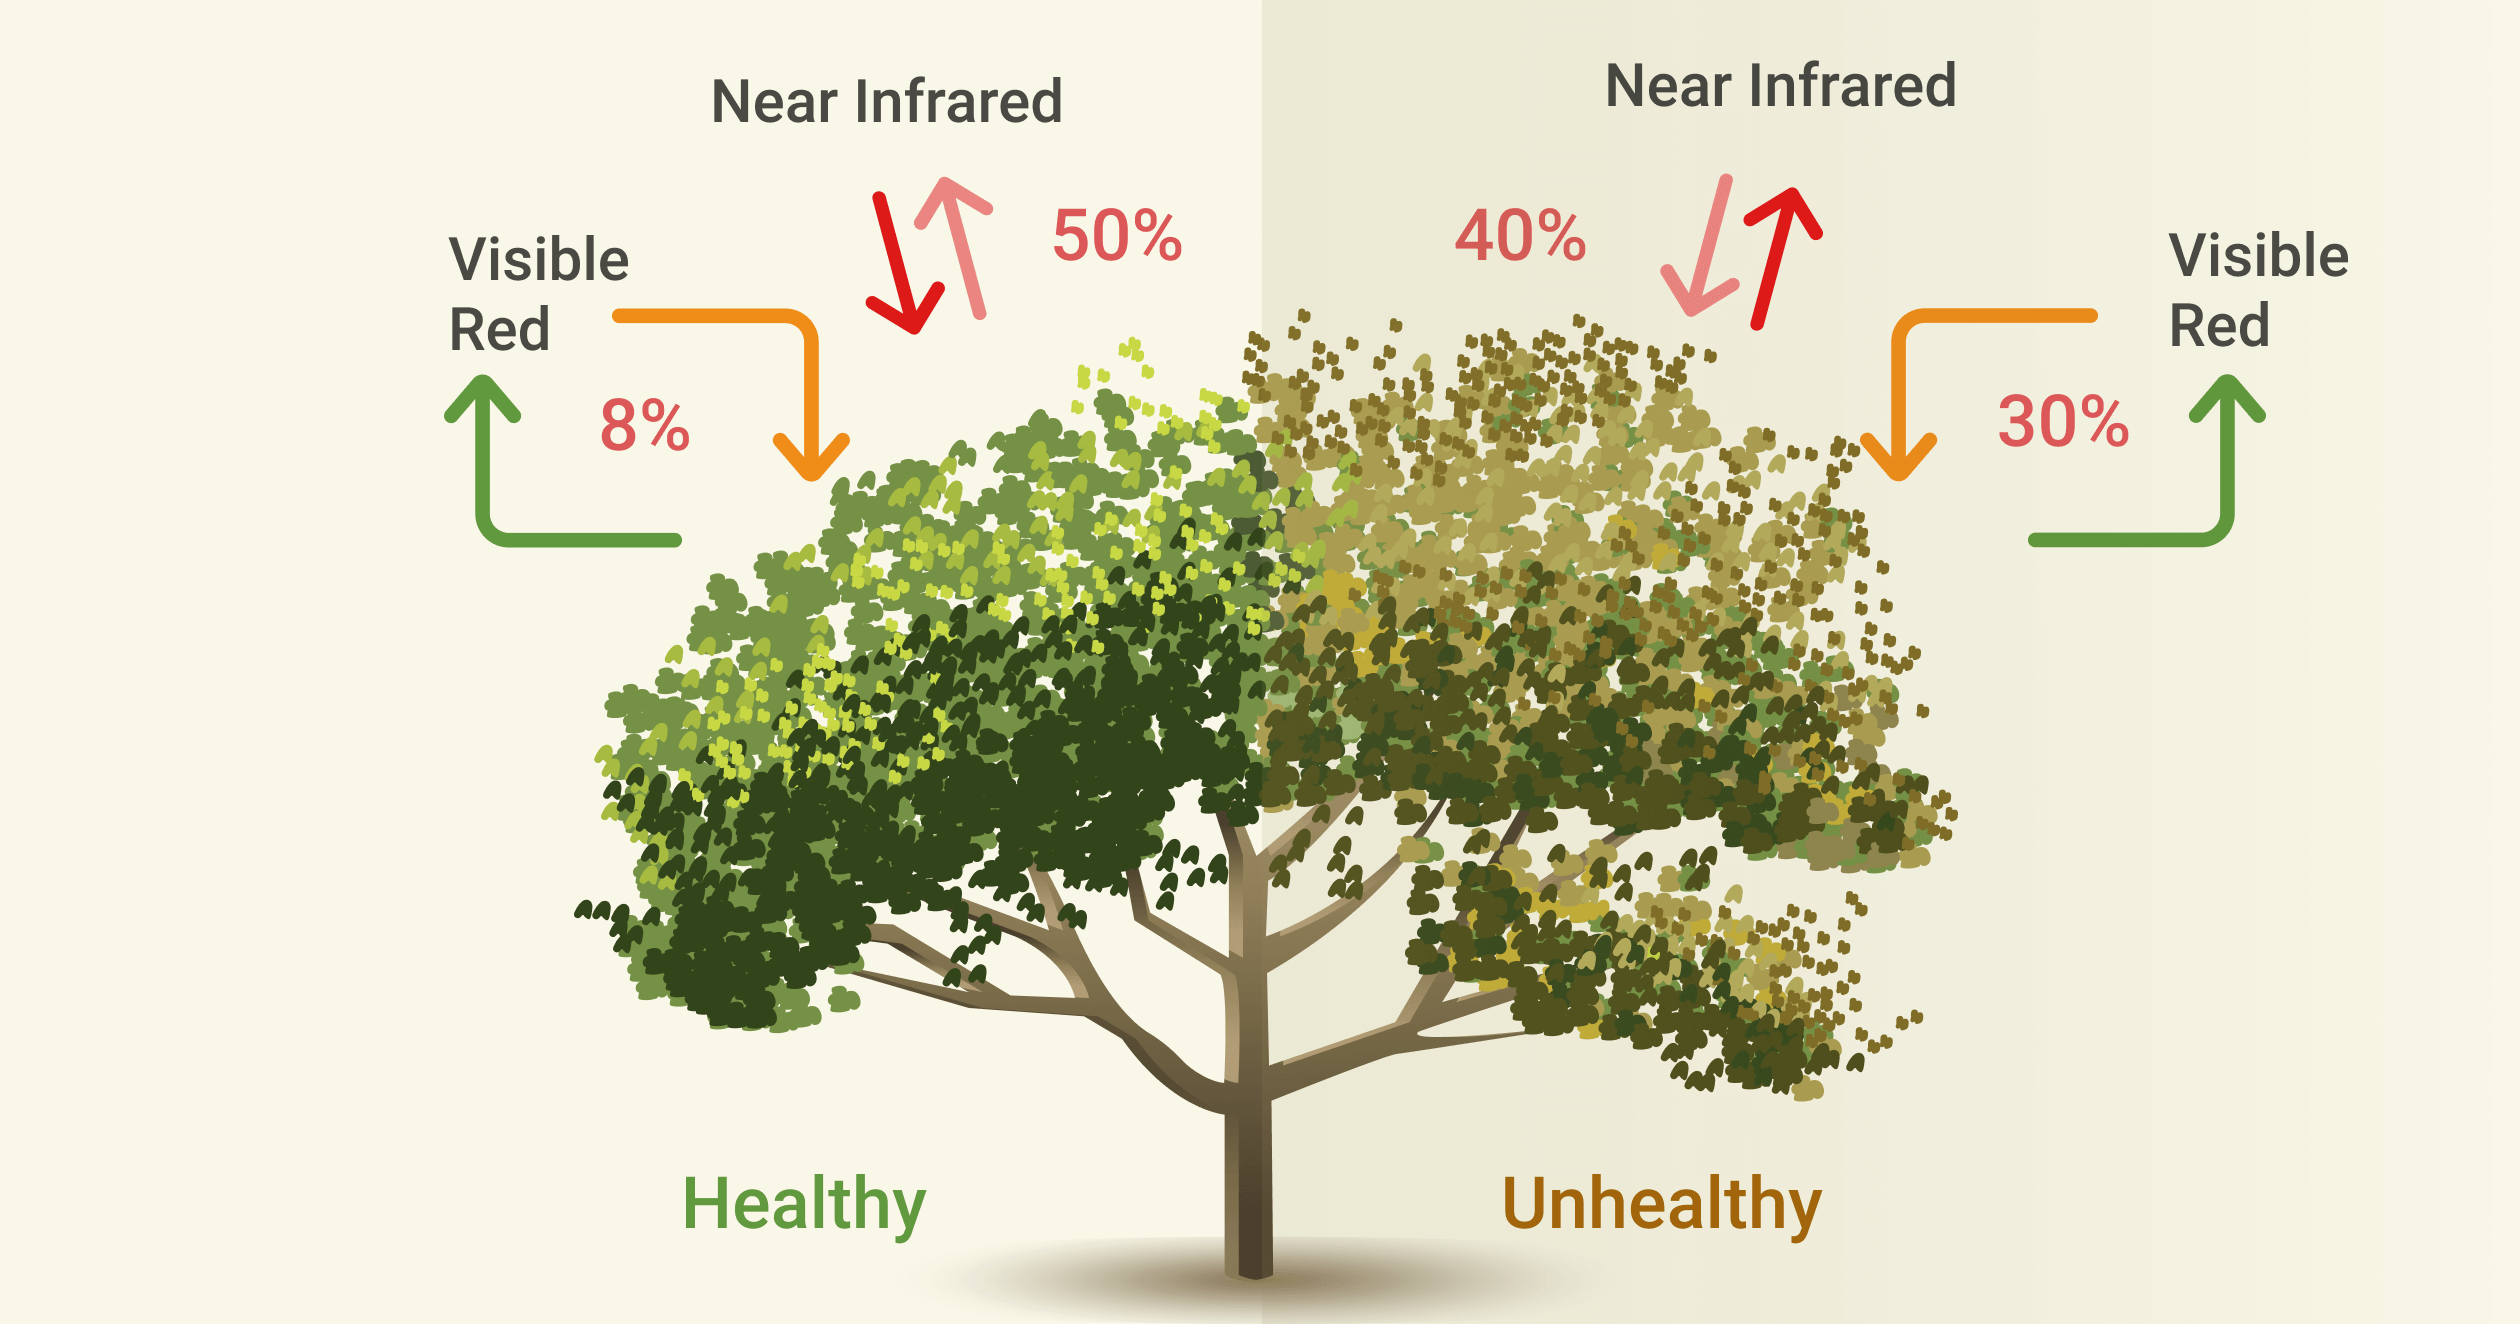
Basically, it works by mathematically comparing the amount of absorbed visible red light and the reflected near-infrared light. And here’s why.
The chlorophyll pigment in a healthy plant absorbs most of the visible red light, while the cell structure of a plant reflects most of the near-infrared light. It implies that high photosynthetic activity, commonly related to dense vegetation, will have less reflectance within the red band and better reflectance within the near-infrared one. By observing how these values compare to every other, you'll be able to reliably detect and analyze vegetation cover separately from other styles of natural land cover.
What NDVI value represents healthy vegetation, a positive one or a negative one?
As you'll know, the results of the NDVI calculation range from -1 to 1. Negative values correspond to areas with water surfaces, manmade structures, rocks, clouds, and snow; bare soil usually falls within the 0.1- 0.2 range; and plants will always have positive values between 0.2 and 1. Healthy, dense vegetation canopy should be above 0.5, and sparse vegetation will possibly fall within 0.2 to 0.5. However, it’s only a rule of thumb and you ought to always take into consideration the season, style of plant ,and regional peculiarities to understand exactly what NDVI values mean.
How to interpret NDVI images?
Traditionally, NDVI results are presented as a color map, where each color corresponds to a certain range of values. There’s no standard color palette, but most software uses the “red-green” one, meaning that red-orange-yellow tints indicate bare soil or dead/sparse vegetation, and all shades of green are a sign of normal to dense vegetation cover.
What are the alternatives to NDVI?
Actually, there is a fair amount of vegetation indices, which are based on the standard NDVI. Unlike it, they are adjusted for soil brightness, atmospheric effects, and other factors usually affecting NDVI results. They are EVI, SAVI, ARVI, GCL, and SIPI
What does an NDVI measure in crops?
Simply put, NDVI measures the state and health of crops or crop vigor. This vegetation index is an indicator of greenness and contains a strong correlation with green biomass, which is indicative of growth. NDVI values also are known to own a high correlation with crop yield, meaning it will be used as a tool for measuring crop productivity and predicting future yield.
How to use NDVI in agriculture?
When it comes to crops, there are a bunch of applications. NDVI can be used to:
1) Measure biomass and assess the state and health of crops
2) Identify pests, diseases, fungus, or overly dry spots in the field before the damage is done
3) Observe vegetation dynamics throughout the growing season
4) Establish normal growing conditions for the crops in the specific area with NDVI Time Series
5) Estimate crop yields (never alone, only combined with other parameters used for prediction)
6) Detect areas of concern within the field faster, and spend water, crop nutrients, and pesticides more effectively
7) Monitor pasture conditions and productivity
8) Monitor drought and assist in forecasting fire-hazardous areas
How to differentiate between crops and trees?
We agree this could be tricky. Both crops and trees can have high NDVI values, which makes it challenging to tell apart between the two. the simplest way is to calculate the mean NDVI value for each of the three months within the past year. The vegetated areas having high NDVI values for quite 3 months during a row will possibly mean a coniferous forest. Crops rarely maintain high NDVI this long.