All you need to know about EVI
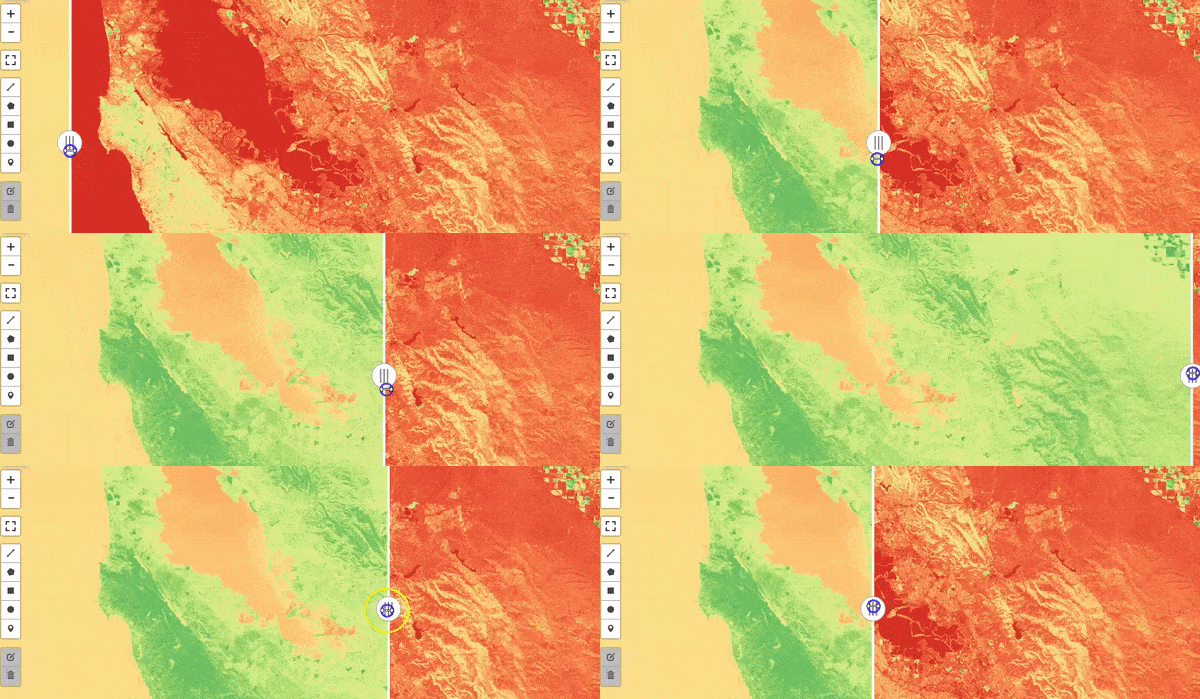
Published on Dec 29, 2024 | Bikesh Bade | 49 Views
The enhanced vegetation index (EVI) is an 'optimized' vegetation index designed to enhance the vegetation signal with improved sensitivity in high biomass regions and improved vegetation monitoring through a de-coupling of the canopy background signal and a reduction in atmosphere influences.EVI is similar to the Normalized Difference Vegetation Index (NDVI) and can be used to quantify vegetation greenness. However, EVI corrects for some atmospheric conditions and canopy background noise and is more sensitive in areas with dense vegetation.
What is EVI in remote sensing?
The enhanced vegetation index (EVI) was developed as an alternative vegetation index to address some of the limitations of the NDVI. The EVI was specifically developed to:
- be more sensitive to changes in areas having high biomass (a serious shortcoming of NDVI),
- reduce the influence of atmospheric conditions on vegetation index values, and
- correct for canopy background signals.
How to calculate EVI?
The Enhanced Vegetation Index (EVI) is calculated similarly to NDVI but uses additional wavelengths of light to correct for the inaccuracies of NDVI. Variations in solar incidence angle, atmospheric conditions like distortions in the reflected light caused by the particles in the air, and signals from the ground cover below the vegetation are corrected for using EVI. EVI is computed following this equation:
where NIR/red/blue are atmospherically-corrected or partially atmosphere-corrected surface reflectances, L is the canopy background adjustment that addresses non-linear, differential NIR and red radiant transfer through a canopy, and C1, C2 are the coefficients of the aerosol resistance term, which uses the blue band to correct for aerosol influences in the red band. The coefficients adopted in the MODIS-EVI algorithm are; L=1, C1 = 6, C2 = 7.5, and G (gain factor) = 2.5.(source Wikipedia)
How to calculate EVI in different Satellites?
In Landsat 4-7, EVI = 2.5 * ((Band 4 – Band 3) / (Band 4 + 6 * Band 3 – 7.5 * Band 1 + 1)).
In Landsat 8, EVI = 2.5 * ((Band 5 – Band 4) / (Band 5 + 6 * Band 4 – 7.5 * Band 2 + 1)).
In Sentinal 2, EVI = 2.5 * ((Band 8 – Band 4) / (Band 8 + 6 * Band 4 – 7.5 * Band 2 + 1)).
In Modis, Terra Vegetation Global Collection has an EVI layer
How does EVI work?
The enhanced vegetation index (EVI) is an 'optimized' vegetation index designed to enhance the vegetation signal with improved sensitivity in high biomass regions and improved vegetation monitoring through a de-coupling of the canopy background signal and a reduction in atmosphere influences. EVI tends to be more sensitive to plant canopy differences like leaf area index (LAI), canopy structure, and plant phenology
How do we interpret EVI images?
Traditionally, EVI results are presented as a color map, where each color corresponds to a certain range of values. There’s no standard color palette, but most software uses the “red-green”. The following palette is mostly used while interpreting EVI
palette: [
    'FFFFFF', 'CE7E45', 'DF923D', 'F1B555', 'FCD163', '99B718', '74A901',
    '66A000', '529400', '3E8601', '207401', '056201', '004C00', '023B01',
    '012E01', '011D01', '011301'
  ]
How does it differ from NDVI?
Normalized Difference Vegetation Index (NDVI) is chlorophyll sensitive, the EVI is more responsive to canopy structural variations, including leaf area index(LAI), canopy type, plant physiognomy, and canopy architecture.
The Enhanced Vegetation Index (EVI) is calculated similarly to NDVI but uses additional wavelengths of light to correct for the inaccuracies of NDVI.
One of the most important shortcomings of NDVI is its dependency on the time of day at which the aerial images are taken. Since NDVI does not correct for changes in solar incidence angle (the angle at which the sun shines on the leaves) NDVI produces vastly different results throughout the day.
Another difference between NDVI and EVI is that in the presence of snow, NDVI decreases, while EVI increases
Get all information about NDVI in the link
Application of EVI
EVI has mostly been used for assessments of
- Biomass, biophysical properties like leaf area index,
- Quantification of evapotranspiration or water-use efficiency,
- assessments of change over large areas.
Limitation
One of the biggest current limitations to implementing EVI is that it needs a blue band in order to be calculated. Not only does this limit the sensors that EVI can be applied to (e.g., ASTER has no blue band), but the blue band typically has a low signal-to-noise ratio.
